
Loss analysis

Three clicks from a circle to a named feeder

The same path an analyst takes on a Monday morning. Step through it.
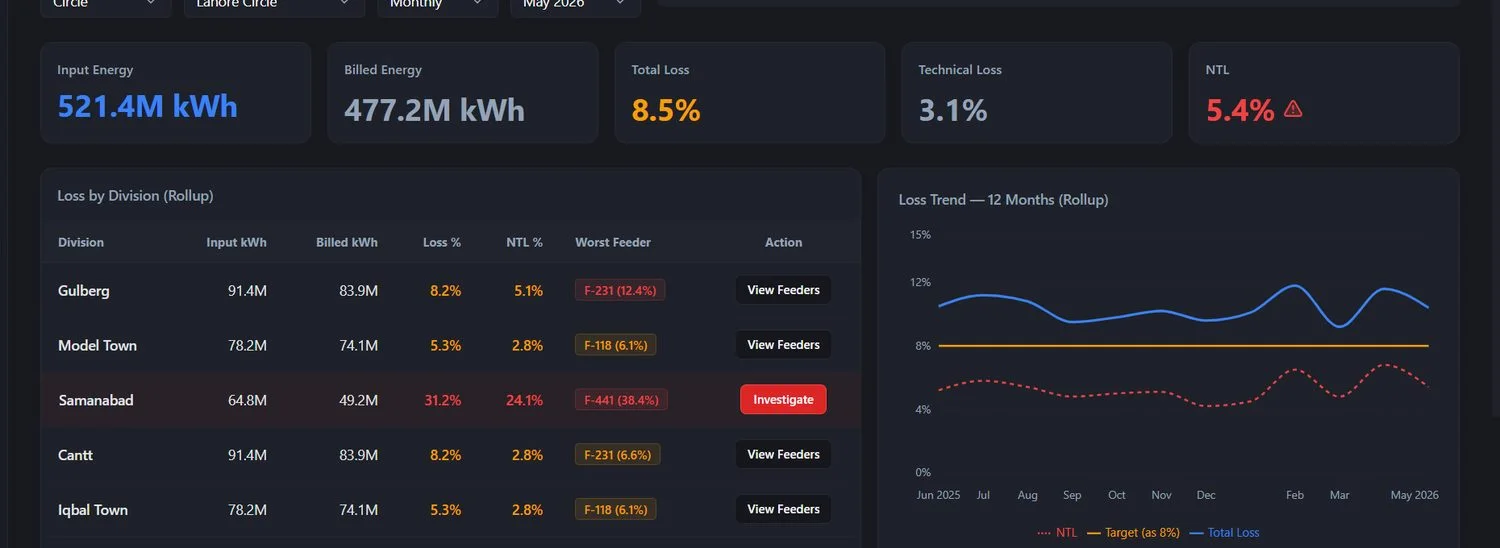
Loss by division for one circle

Note Company, circle, division and sub-division figures are aggregated rollups of their feeders — not independently measured.

How it decides

Four signals, cross-checked continuously

No single signal is conclusive on its own. Confidence comes from agreement between them.

01 Energy balance Feeder or transformer input minus the sum of metered consumption downstream. Locates where losses sit.
02 Pattern break A consumer's own history, and peer profiles on the same feeder. Flags sudden drops.
03 Tamper events Meter alarms: reversal, magnetic interference, cover opened. Confirms interference.
04 Load mismatch Transformer loading against aggregate billed demand on that transformer. Exposes bypass.

The output is not a dashboard. It is a ranked list of places to send a crew.

Tackling the sector's number one challenge

Revenue assurance
Real-time AT&C losses Continuously compares energy input at feeder and transformer level against billed units to compute technical and commercial losses as they occur, rather than waiting for monthly reconciliation.
Theft detection Uses AMI event data and consumption-pattern analytics — sudden drops, tamper alarms, bypass signatures, load mismatches against transformer input — to flag likely theft or illegal connections.
Event and alarms management Tamper alerts, last-gasp outage notification, power quality events, meter reversal and magnetic interference detection, feeding directly into the Outage Management System.
Daily, not monthly Loss tracked day by day against target, so a spike is caught in hours rather than at month-end reconciliation — while the evidence is still there to act on.
Daily loss against target. Twenty-five days on a single feeder. Select to enlarge.
Estimator

What a point of loss is worth

A rough sense of the revenue behind a loss reduction on your own network. Move the sliders.

Recovered annually
Energy recovered per year
Loss after reduction
Recovered per meter per year
Revenue recovered per month

How to read this Indicative only. It assumes recovered units are billed and collected at the average tariff, and it ignores the technical share of loss that no platform can bill for. Use it to frame a conversation, not a business case.

Run this against your own network

Thirty minutes, no slides — your circles, your divisions, your feeders.

Book a Demo